Taranis AcreForward Satellite Layers Explanation
Taranis AcreForward™ satellite layers can help you detect threats and overall crop health risk to drive in-season and long term fertility plans. Learn how:
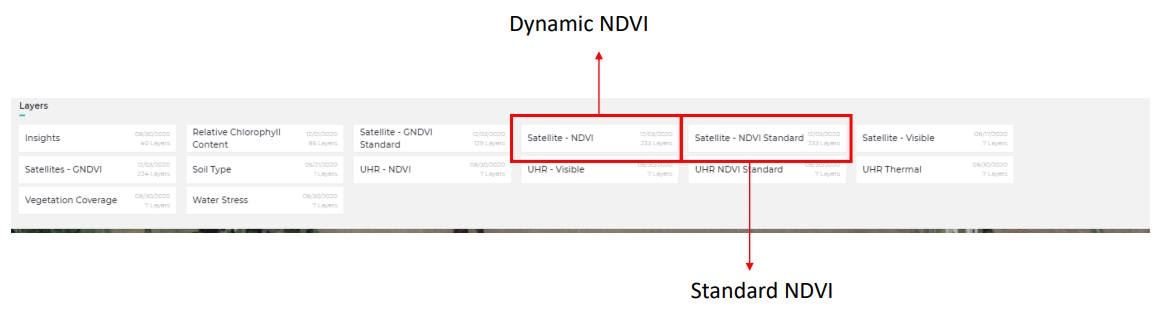
Standard NDVI Is the normal NDVI (Most used one). The range is always the same 0-1. Main uses: compare between dates and between fields. Dynamic NDVI Is NDVI, same as Dynamic, but only shows the region of the Histogram that have values.
How to use Taranis NDVI layers:
Standard NDVI Shows the whole range for NDVI (0: red - 1: dark green).
Follow up crop performance during the season. These images are comparable between dates.
Dynamic NDVI: shows part of the range. Only the part of the range that have values (min value is red – Max value is green)
Look in a specific date to find patterns or areas with anomalies. The areas with problems can be the lowest values or the highest depending in which part of the season the crop is. The images are not comparable between dates (the red pixel in an image can be higher than the green pixels in another image).
It is always important to check what range we are analyzing the image.
Field Health Trends show the subtraction of the NDVI value for two images for the same pixel.
Pro Tip: Find anomalies of growth between two dates in an easy and quick way. In the Standard or Dynamic can have red and green areas but all of them are growing and that´s what the FHT is showing.
SEE THE FIELD HEALTH TRENDS ARTICLE TO FIND OUT MORE.

Related Articles
Map Layers Descriptions
Imagery Name Description Filters Satellite NDVI Dynamic NDVI - The Normalized Difference Vegetation Index (NDVI) is a remote sensing index that quantifies and measures the health and density of vegetation by comparing the reflectance of visible and ...Insect Insight
Taranis SmartScout™ insights can help you detect insect thresholds and overall crop health risk to drive insecticide decisions and long term plans. From the insights multiview tab, you can have full farm view of your insect insights to prioritize ...Stand Count Insight - Corn
Taranis SmartScout™ insights can help you detect uneven emergence and overall beginning crop health risk to drive replant decisions and long term fertility plans. From the insights multiview tab, you can have full farm view of your stand count ...Nutrient Deficiencies Insight
Taranis SmartScout™ insights can help you detect nutrient deficiency symptoms and overall crop health risk to drive in-season and long term fertility plans. Learn how: From the insights multiview tab, you can have full farm view of your insights to ...Defoliation in Soybeans
Taranis SmartScout™ insights can help you detect defoliation and overall insect threshold for crop health risk to drive insecticide decisions and long term plans. You can see whole farm view on the multi view tool to generate which fields have the ...