Understanding the Field Health Insight
1. Select a field health tile on the far right side.

2. This will take you to the most recent satellite image. The outlined areas are above and below average anomalies within the field.
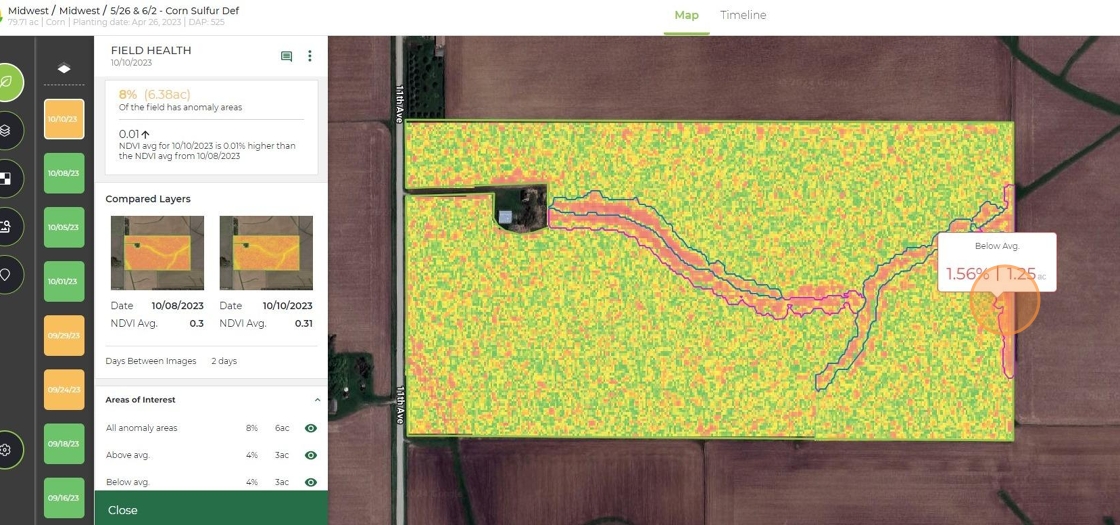
3. You can hover over each area. This will show you the percentage of the field and acre amount.

4. On the left hand side you can see data associated, as well as click on previous dates.

Related Articles
How to Add an Insight Note
1. Click on the field you want to make a note on. There are two different kinds notes that are linked to specific insights and general notes about that field. 2. If you click on a specific insight. 3. You can be on the Timeline or Map view. 4. When ...How to Add a Field Note
1. Click on the field you want to leave a note on. 2. You can be in the Timeline or Map view and click the note icon in the top right next to "Recommendations". 3. Click "Add" at the bottom right. 4. Type whatever note you want that will be ...How to Interpret Taranis Stand Count Insight
1. You can sort stand count from least to greatest to see where thinner stands are. 2. Click the tile of the field you want to look at. 3. You will then see bubbles with stand counts in each data point. 4. On the left hand side you will see target ...How to Interpret Weeds by Species Insight
1. You can sort weed pressure on dashboard by clicking the arrow next to "Weeds". 2. Select the field you want to look at. 3. You will see the map view with a heat map of the weeds on this field. 4. Scroll down to see all the species that were ...How to Interpret Nutrient Deficiencies by Insight
1. Navigate to the field you want to look at. In this example phosphorus was check marked. 2. Scroll down and select the tile for the field you want to look at. 3. This will take you to the map view with the % of images identified with a deficiency ...