How to Interpret Taranis Stand Count Insight
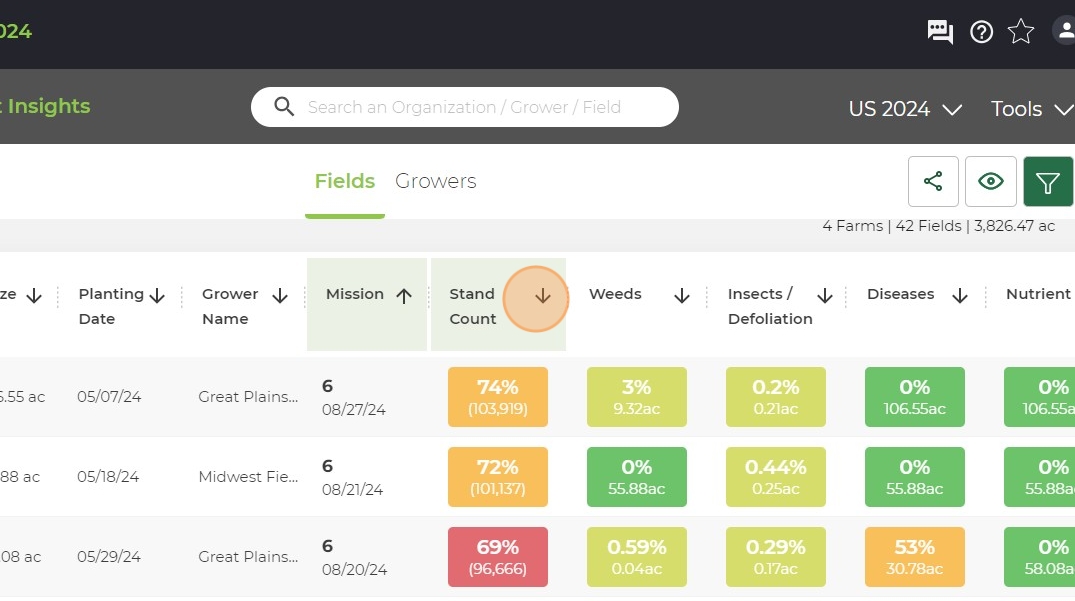
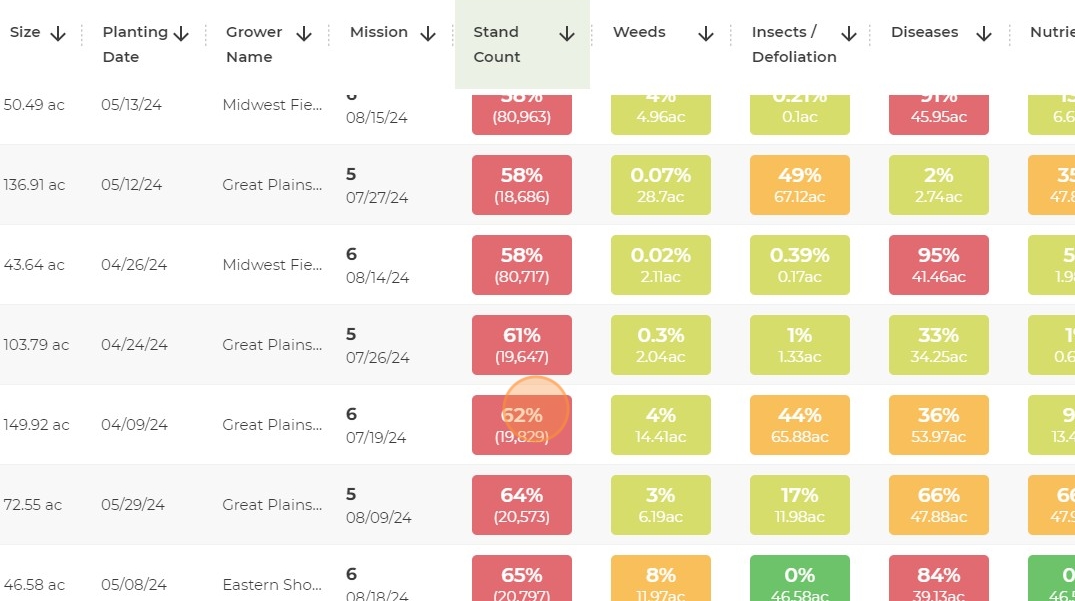
2. Click the tile of the field you want to look at.
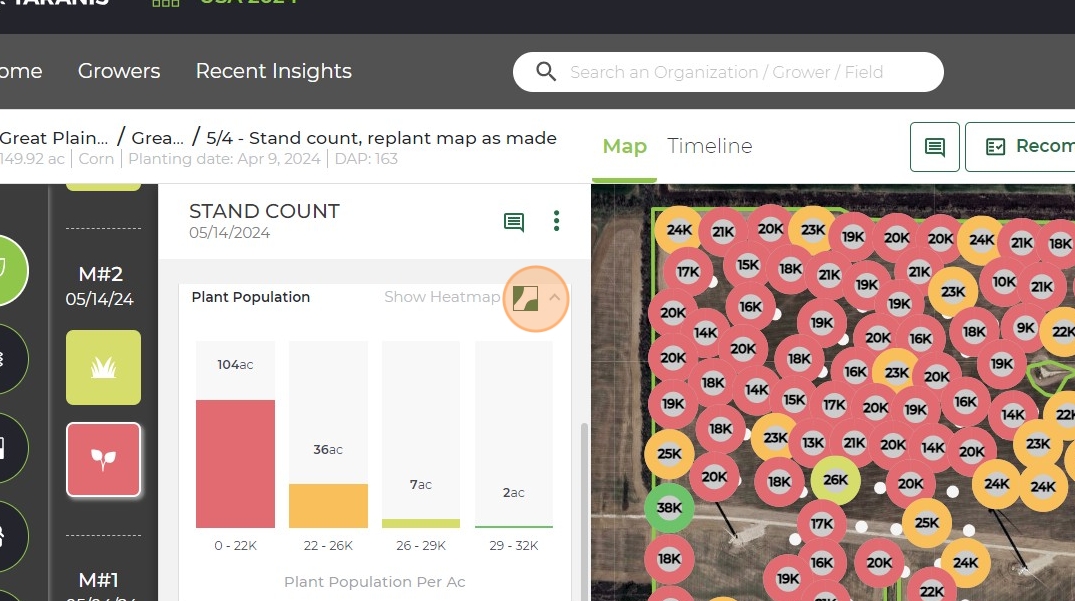
3. You will then see bubbles with stand counts in each data point.
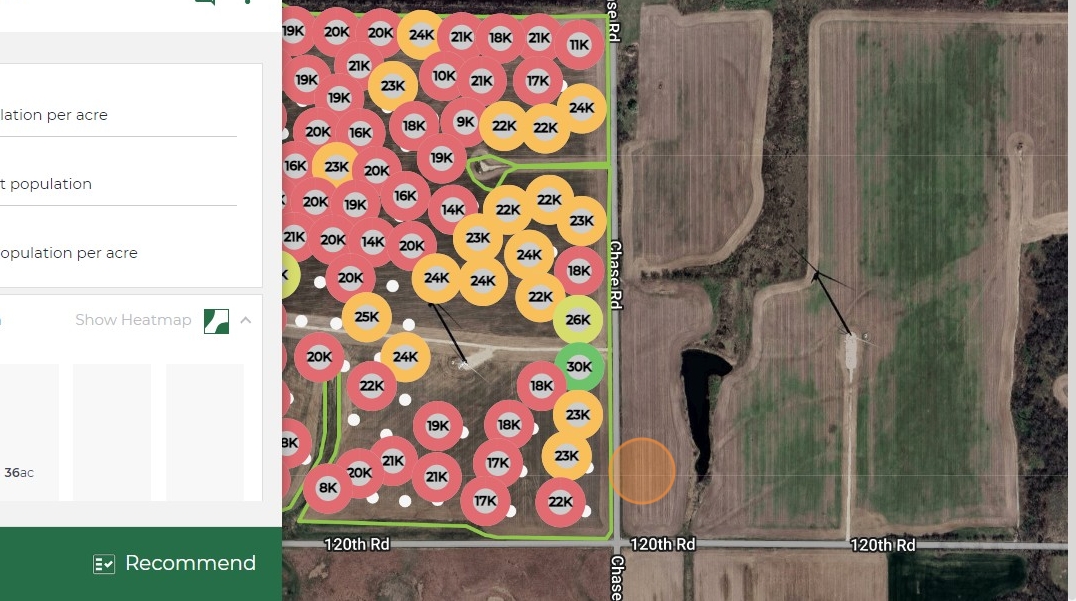
4. On the left hand side you will see target versus average population when this field was flown.
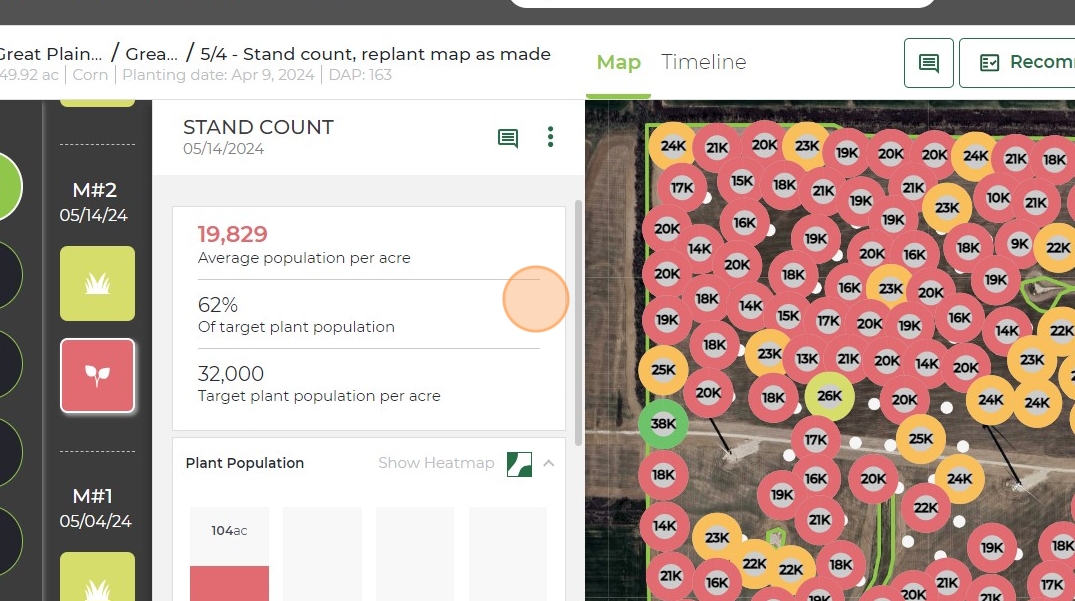
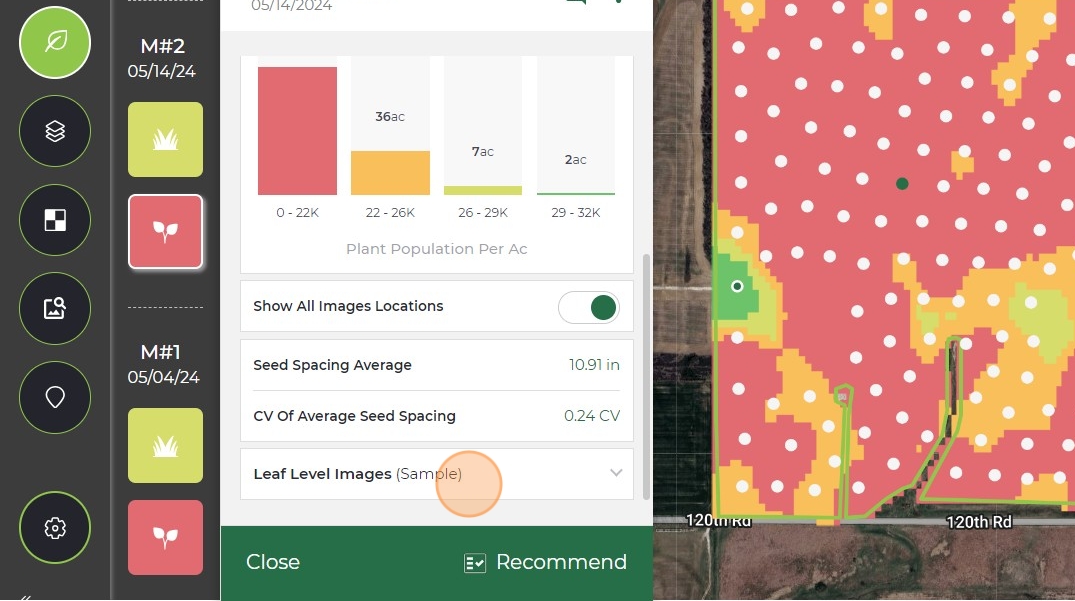
5. There is also a histogram how many acres fall under each threshold. You can also click the "Show Heatmap" icon to switch to that view.
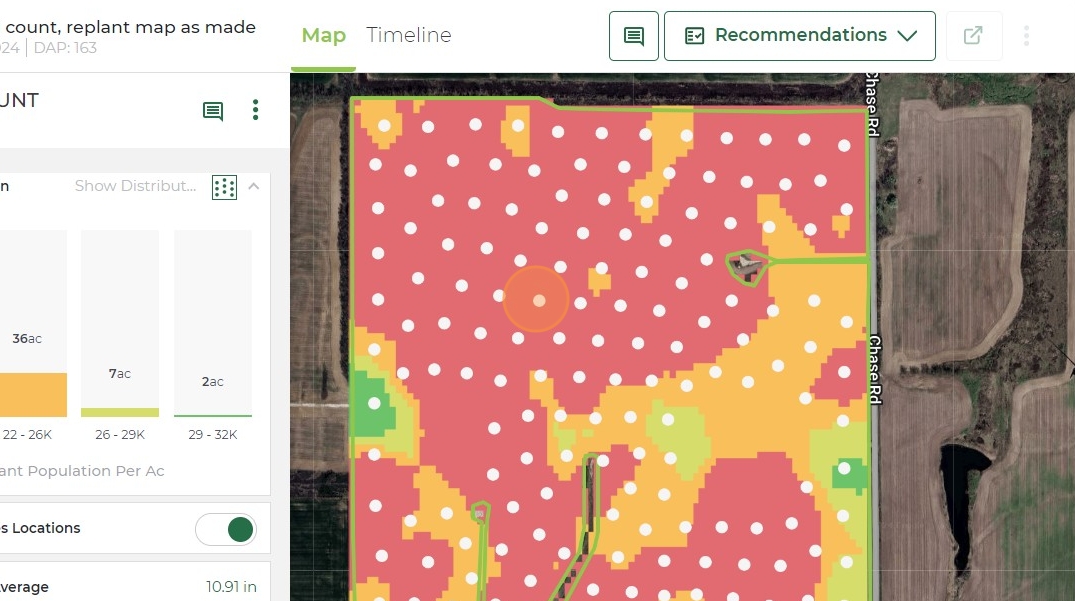
6. This is what the heatmap will look like.
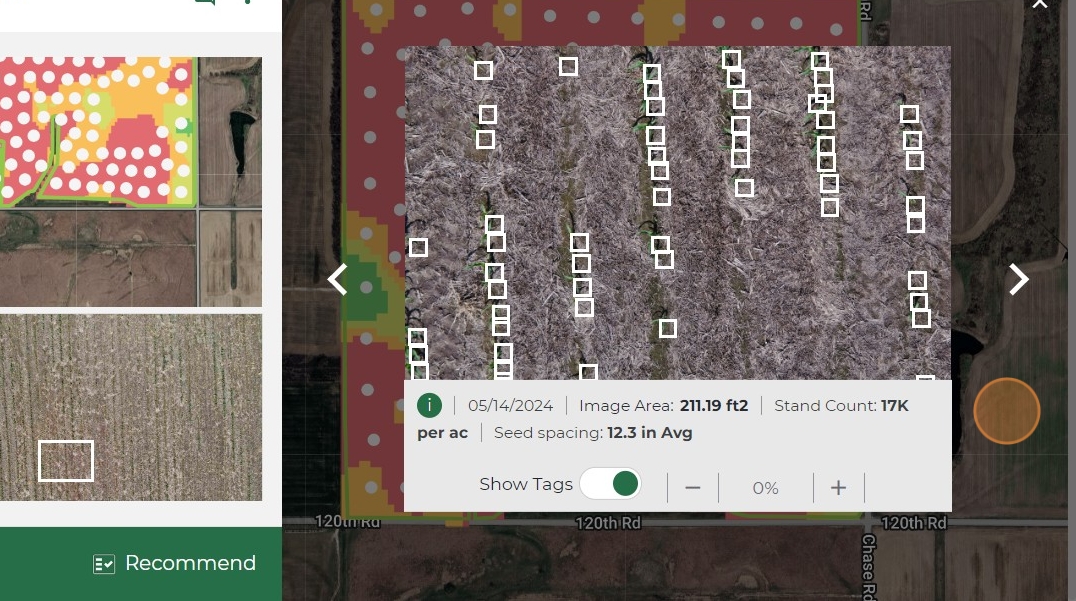
7. You can click any bubble or dot to look at the imagery in detail. The image area, stand count, and seed spacing information is just below the image.
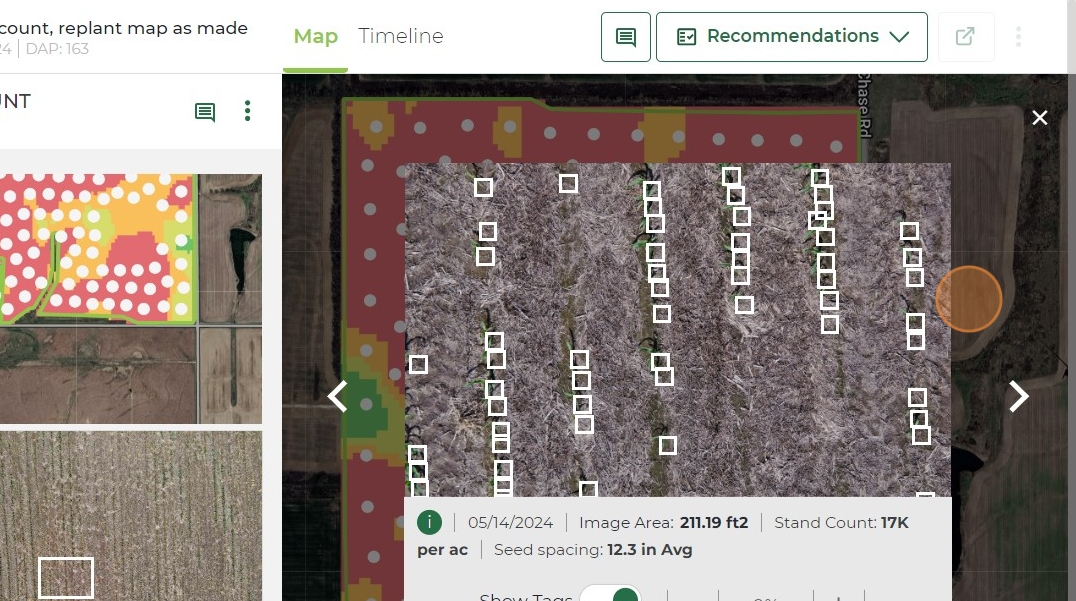
8. The macro view or wide angle view is available if you click on that image in the lower left corner of this screenshot. You can toggle between images.
9. You can click "Leaf Level Images" to see a sample of images from each threshold.
Related Articles
Understanding 2025 Soybean Stand Count
Advancing Soybean Stand Count Insights Accurately assessing soybean stand is key to evaluating crop establishment and replant decisions. In 2025, Taranis improved this process by shifting from individual plant counts to percent canopy coverage. This ...Qcomment: How to Provide Feedback on Taranis Insights
Overview Qcomment is a feature in the Taranis platform that allows customers to provide feedback directly on imagery and insights generated from a mission. Users can flag observations or provide corrections based on what they are seeing in the field, ...Creating a Replant Prescription in the Taranis Web App
Taranis stand count insights make it easy to identify underperforming areas in a field and take action quickly. By using emergence data from your early missions, you can create a replant prescription directly within the Taranis Web App. Whether ...Taking Notes in the Taranis Web App
Taranis gives users the ability to document field-level insights, observations, and agronomic decisions throughout the season using two types of notes. These tools support internal collaboration, improve follow-through on recommendations, and help ...How to Interpret Weeds by Species Insight
1. You can sort weed pressure on dashboard by clicking the arrow next to "Weeds". 2. Select the field you want to look at. 3. You will see the map view with a heat map of the weeds on this field. 4. Scroll down to see all the species that were ...